Analysing social media content quality and perceived moods
Experimental Design Data Visualization Storytelling
2020
Endless hours of mindless scrolling through social media pages had become increasingly frustrating. The weight of this daily information digest grew heavier with the surge of misinformation and fake news that followed the Lebanese October 2019 protests.
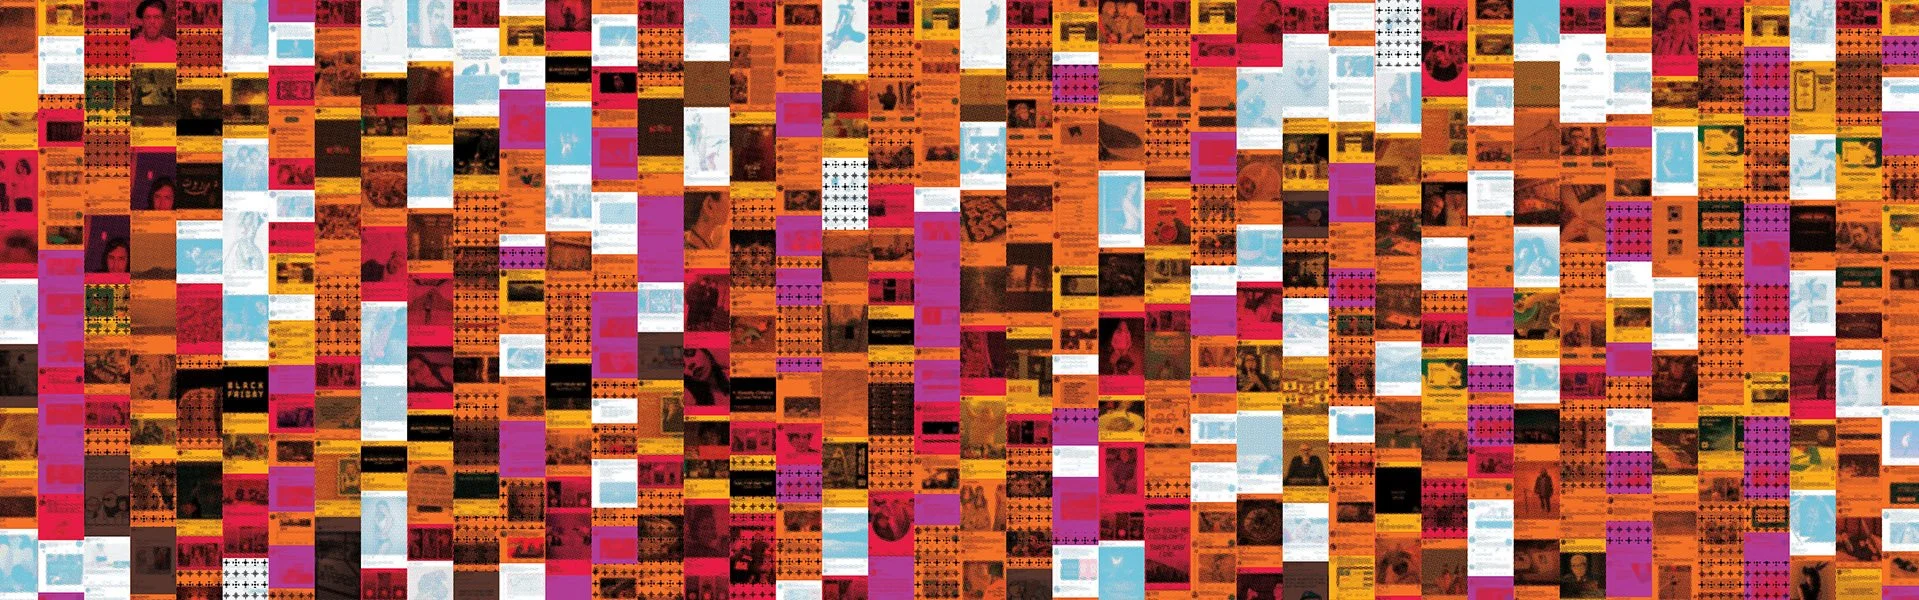
In an attempt to quantify and analyze my emotional responses to this overwhelming feed, I captured 42 screenshots from Facebook, Instagram, and Twitter (Now X). Each post was then observed and color-coded based on common reactions, as outlined in the map key at the bottom of graphic.
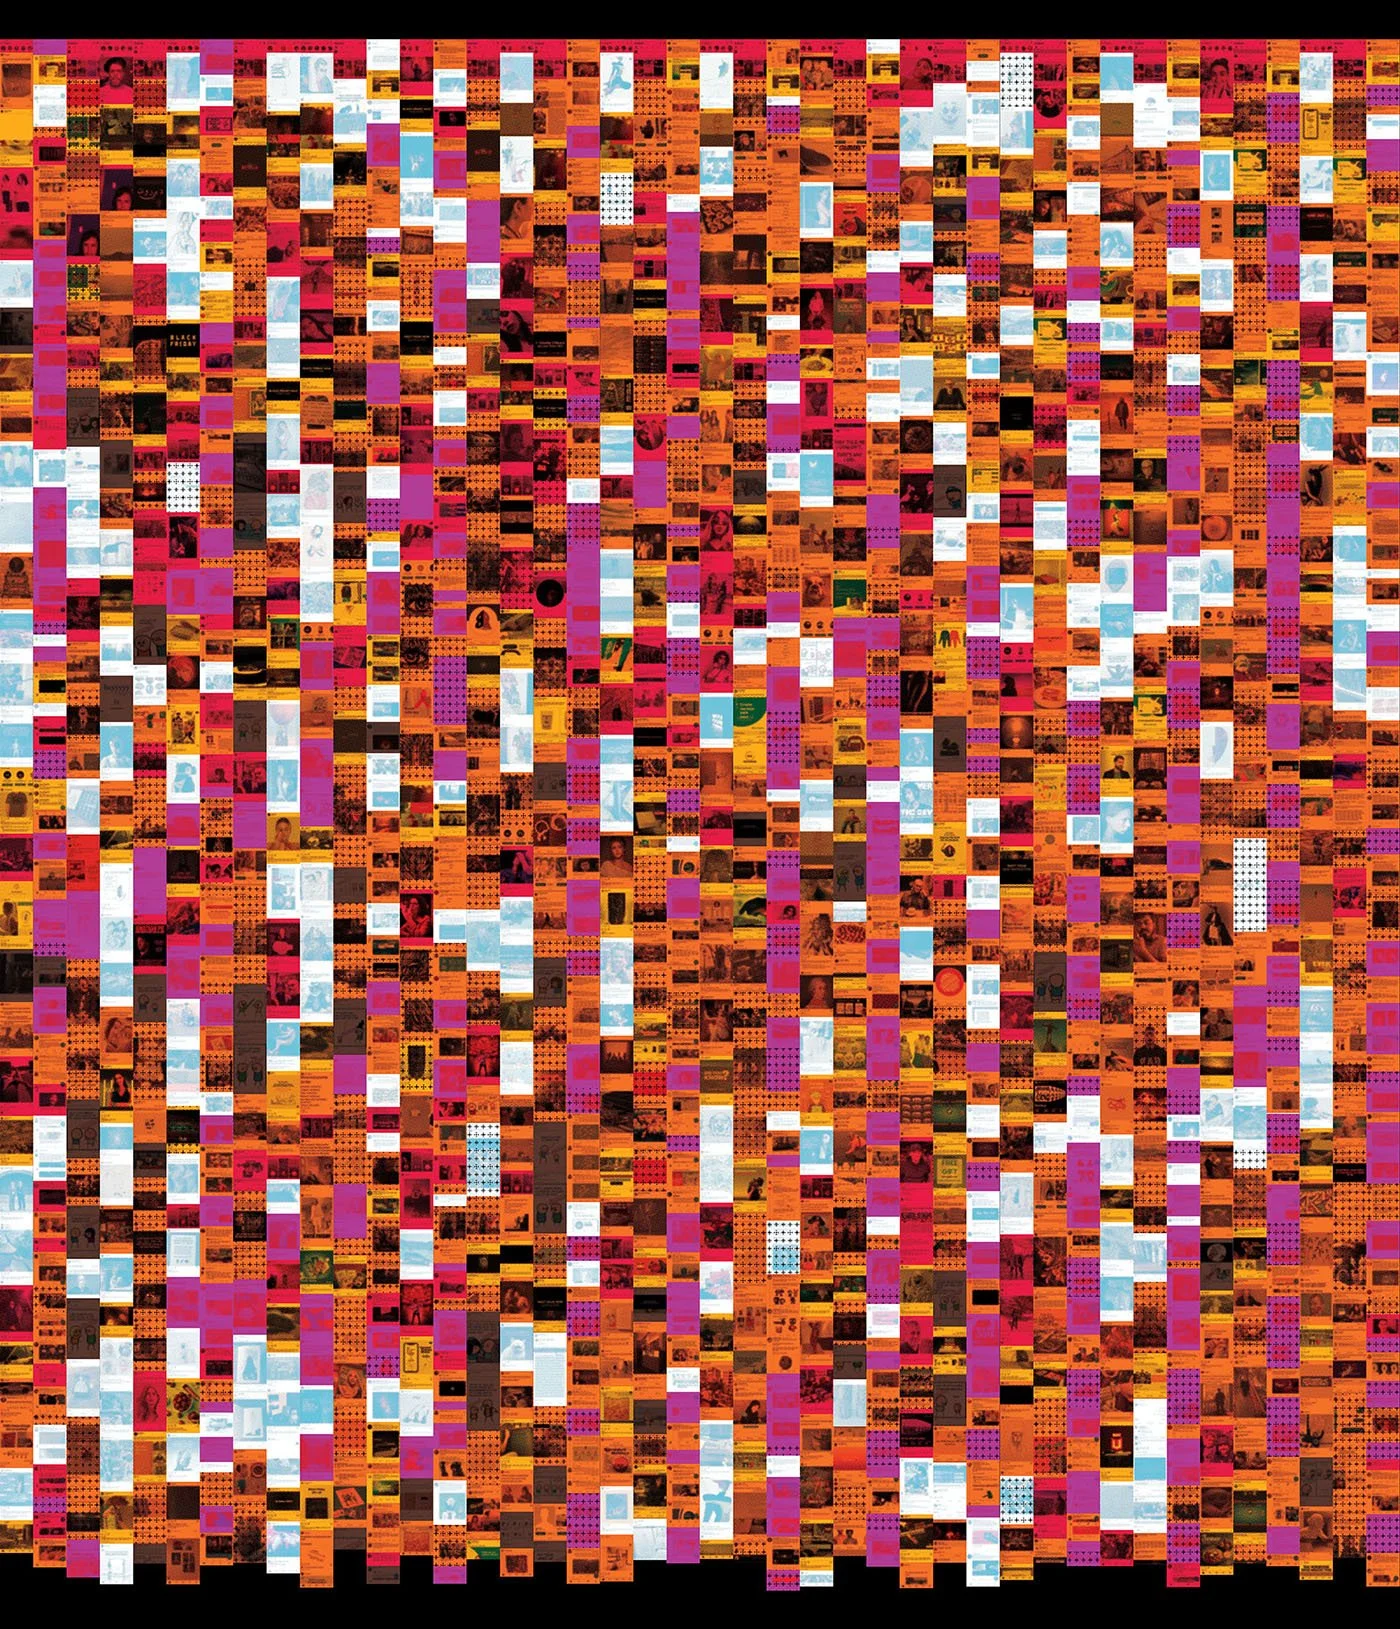

The resulting data-heavy print poster presented an analysis of 1,400 social media posts consumed over 14 days. Posts that triggered a positive emotional response made up only 19% of the total.
The poster was exhibited at the Goethe-Institut Beirut as part of a collective design exhibition from February 2020 until August 4th, 2020, when the massive ammonium nitrate explosion at the Beirut Port abruptly ended the show.